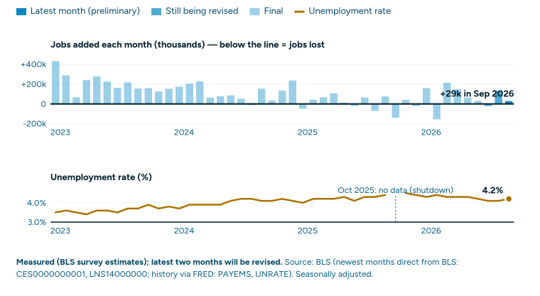
The Bureau of Labor Statistics (BLS) reported that nonfarm payrolls rose by just 29,000 in September, well below consensus expectations of around 90,000, while downward revisions cut a combined 60,000 jobs from July and August, leaving July with a net loss of 10,000.
The unemployment rate edged up to 4.2% from 4.1%, partly reflecting a rise in the labour force participation rate to 61.8%, while wage growth was sluggish. BLS data also showed job openings falling to 7.08 million in August.
Inflation data also provided some relief, with headline PCE inflation rising 0.3% in August and holding at 3.4% year on year, while core PCE inflation, which excludes food and energy prices, increased 0.2% and remained at 3.0% year on year. Both annual inflation measures were unchanged from July’s revised readings.
Second-quarter GDP growth was revised higher to an annualised 2.2%, from 1.5%, primarily reflecting stronger investment, consumer spending and government spending. Expectations for an October rate hike fell from around 70% earlier in the week, following softer payrolls data and comments from Fed officials indicating that there was no urgency for a further increase following September’s hike.
Manufacturing activity remained in expansion territory in September, with the ISM Manufacturing PMI registering 54.5, marking a ninth consecutive month of expansion. New orders and employment strengthened, although the prices paid index rose sharply by 6.8 points to 77.9, its highest reading since May, pointing to renewed input cost pressures.
Eurozone inflation surprised to the upside in September, accelerating to 3.8% from 3.2% in August and exceeding expectations of 3.6%. The broader rise in inflation across the region reinforced expectations that the ECB may need to maintain a restrictive policy stance.
In the UK, revised data showed the economy expanded 0.5% in the second quarter, slightly above the previous estimate of 0.4%, with services remaining the principal driver of growth. Elevated gilt yields continued to create a challenging backdrop for rate-sensitive sectors, keeping attention focused on borrowing costs and the outlook for fiscal policy. Manufacturing activity also remained in expansion territory, with the S&P Global UK Manufacturing PMI rising to 51.9 in September, from 51.7 in August.
In Japan, rising inflation kept expectations of further BoJ tightening in focus, with Tokyo-area core CPI accelerating to 2.7% year on year in September, from 1.8% in August. However, underlying activity remained mixed, with industrial production falling 1.7% month on month in August, while sentiment among large manufacturers improved modestly.
In China, economic activity showed signs of improvement, with the official Manufacturing PMI returning to expansion at 50.1 in September, from 49.8 in August, alongside a pickup in services activity. Authorities also announced the country’s largest stimulus package since 2024, including mortgage interest subsidies for qualified first-time homebuyers. However, the measures received a muted response from investors, with some market participants viewing the measures as insufficient to address ongoing structural challenges.
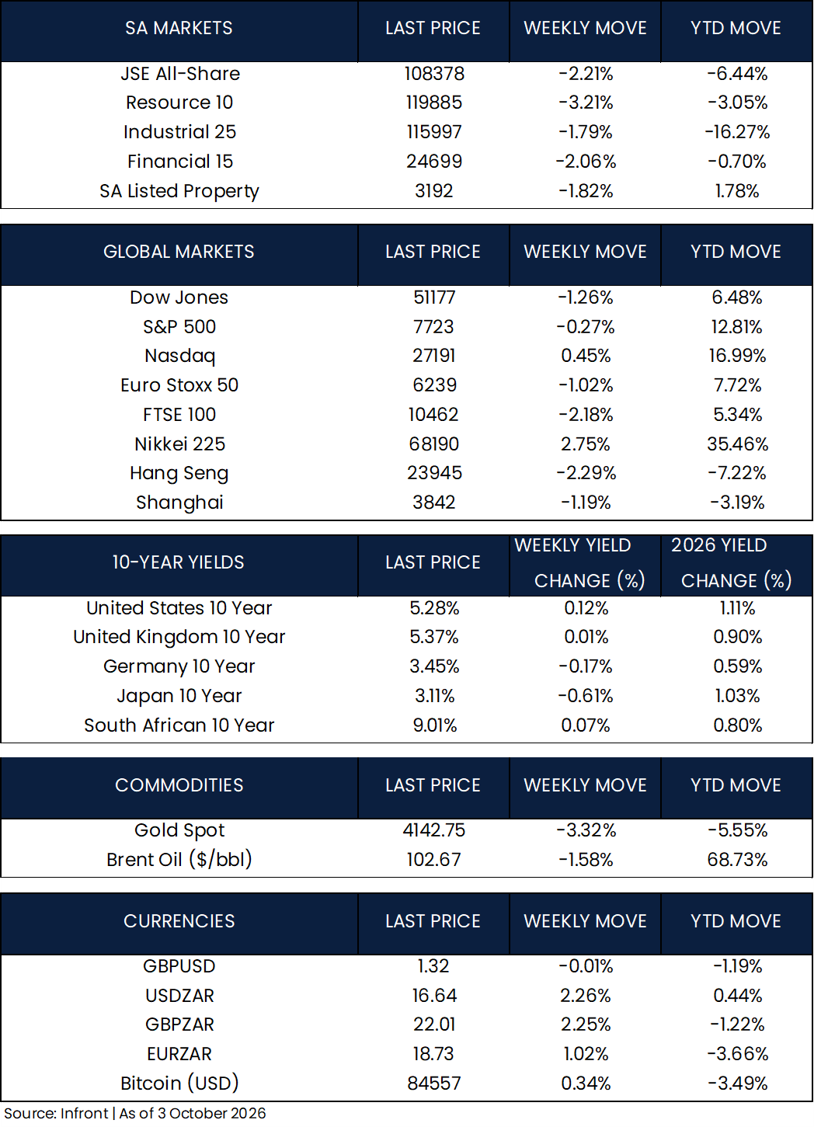
US equities finished the week mixed as investors weighed softer US jobs data against elevated Treasury yields and volatile oil prices. The Dow Jones Industrial Average fell 1.26% and the S&P 500 declined 0.27%, while the tech-heavy Nasdaq Composite gained 0.45%.
The cautious tone extended into Europe, where higher-than-expected eurozone inflation, elevated oil prices and rising sovereign yields weighed on sentiment. The pan-European STOXX Europe 50 fell 1.02%, while the UK’s FTSE 100 declined 2.18%.
Asian markets were more mixed. In Japan, the Nikkei 225 rose 2.93%, supported by gains in AI- and semiconductor-related shares. In China, mainland markets were closed on Thursday and Friday for the Golden Week holiday. Over the three trading days through Wednesday, the Shanghai Composite fell 1.19%, while Hang Seng also fell 2.29%, with financial and technology stocks among the biggest laggards.
Against this backdrop, global sovereign bond markets remained under pressure, with the US 10-year Treasury yield reaching 5.33% and the 30-year yield 5.69% on Thursday, their highest levels since 2002. Softer US economic data subsequently prompted a partial bond rally, with the US 10-year yield ending the week at 5.28%, up 12 bps. In Japan, the 10-year JGB yield also rose above 3%, reaching a 30-year high.
Market Moves of the Week:
South African economic data remained mixed, with some improvement in manufacturing activity but continued weakness in employment. The Absa Purchasing Managers’ Index (PMI), compiled by the Bureau for Economic Research (BER), rose 4.9 points to 50.7 in September, returning to expansion territory after three consecutive months of contraction, as new sales orders rebounded sharply.
Producer price inflation eased to 5.0% year on year in August, from 5.7% in July, while South Africa recorded a preliminary trade surplus of R20.5 billion in August, supported by exports of R181.8 billion against imports of R161.3 billion.
The labour market remained under pressure. Stats SA’s latest Quarterly Employment Statistics showed formal non-agricultural employment declining by 14,000 quarter-on-quarter and by 95,000 year-on-year in the second quarter. Full-time employment fell by 96,000 year-on-year, pointing to continued weakness in formal job creation. The broader Quarterly Labour Force Survey also showed the unemployment rate rising to 33.6% in the second quarter.
Local equity markets weakened over the week, with the JSE All Share Index falling 2.21%, with all sectors declining and resources leading the losses at 3.21%. The rand depreciated 2.26% against the US dollar to R16.64/$, as a stronger greenback and rising global bond yields weighed on emerging market assets and outweighed supportive domestic data.
Chart of the Week:
Important Information
The information included above as well as individual companies and/or securities mentioned should not be construed as investment advice, a recommendation to buy or sell or an indication of trading intent on behalf of any STRATEGIQ Capital product. This material is provided for informational purposes only and is not intended to be investment advice or a recommendation to take any particular investment action. Information contained herein is based upon sources we consider to be reliable; we do not, however, guarantee its accuracy. All charts and tables are shown for illustrative purposes only.
STRATEGIQ Capital is an authorised financial services provider (FSP 46624).